A Guide on NDVI, NDWI and Derived Bands
Sensors on satellites are designed to detect different frequencies along the electromagnetic (EM) spectrum, offering a comprehensive view of our planet's features and activities.

Satellites are capable of capturing many different types of high-quality images thanks to the variety of sensors they are equipped with. These sensors, designed to detect different frequencies along the electromagnetic (EM) spectrum, offer a comprehensive view of our planet’s features and activities. Derived bands such as Normalised Difference Vegetation Index (NDVI), Normalised Difference Water Index (NDWI), and Normalised Difference Moisture Index (NDMI) are calculated through equations combining data from spectral bands corresponding to these different wavelengths. These bands are used to produce Earth observation imagery that provides valuable information for evaluating what is happening on the surface of the earth.
What are Derived Bands?
The functionality of the sensors is based on the reflection and absorption characteristics of different materials at different wavelengths. For example, when you look at a plant, you see the colour green. That is because chlorophyll, the pigment in leaves, reflects green visible light waves. Just beyond the visible light spectrum are the wavelengths, near-infrared (NIR) and short wave infrared (SWIR). The properties of water, dry land, and healthy plants, will interact differently with each of these wavelengths. Healthy plants reflect NIR and Green visible light, but absorb SWIR and Red visible light. On the other hand, water absorbs all four of those wavelengths, providing useful information for determining terrestrial boundaries and moisture levels. Equations have been developed using combinations of these wavelengths. The indices that are derived from these equations include NDVI, NDWI, and NDMI. These derived bands are a few commonly used indices which provide quantifiable values that provide important information about boundaries between land and water, flooded or dry areas, and plant health.
The distinction between land and water in satellite imagery is significant to agriculture and ecology. The interaction of different wavelengths with these two elements produces distinct patterns, as they are absorbed or reflected. These patterns can then be deciphered to create accurate, high-quality satellite images.
Land vs. Water
The distinction between land and water in satellite imagery is significant to agriculture and ecology. The interaction of different wavelengths with these two elements produces distinct patterns, as they are absorbed or reflected. These patterns can then be deciphered to create accurate, high-quality satellite images.
Comparison of Derived Bands
Overview

Normalised Difference Vegetation Index (NDVI)
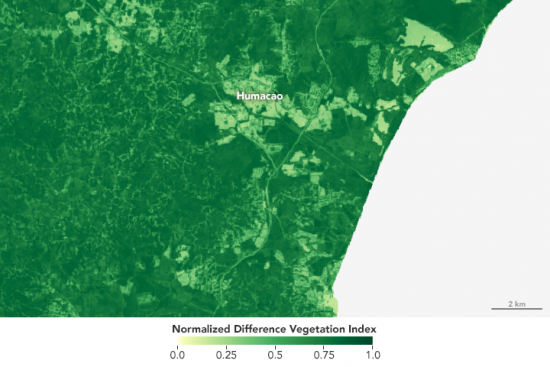
Captured by Landsat- 8 OLI December 2016.
NDVI is the most commonly used vegetation index to identify vegetation health. To calculate the index, NIR and visible Red light are the bands used in the following equation:

The resulting value ranges from -1 to +1, with the following indications:

The NDVI values obtained are useful to several industries. In agriculture, the values are helpful in measuring crop biomass and managing crop production strategies with precision agriculture. In the forestry field, NDVI aids in identifying growth patterns and conditions to help with conservation initiatives.
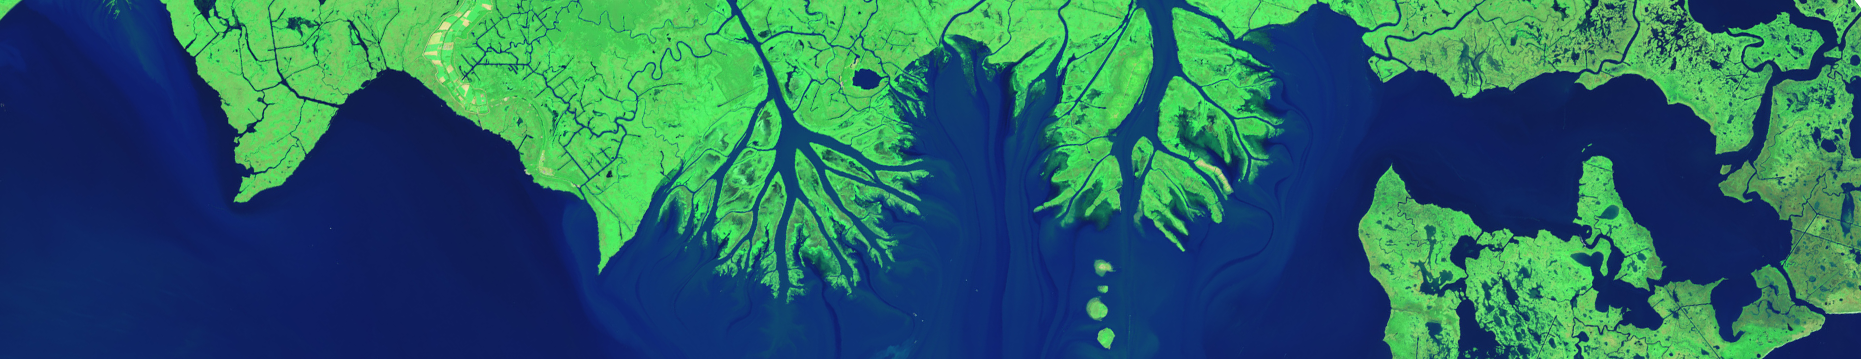
Normalised Difference Water Index (NDWI)
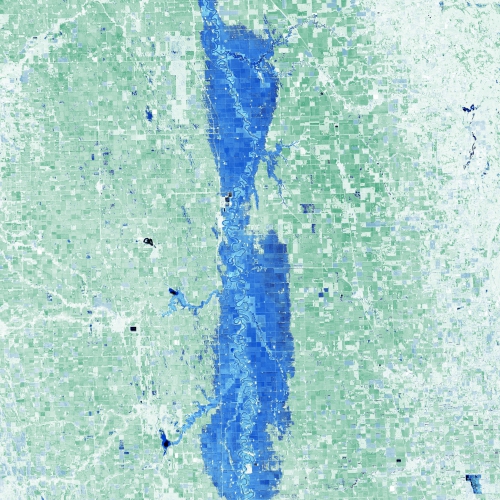
Captured by Landsat- 8 OLI on 17 April, 2020.
NDWI is an index used to identify water bodies. The bands used to calculate the index are visible Green light and NIR or SWIR, depending on the available sensors. Values are determined using the following equation:

The resulting value ranges from -1 to +1, with the following indications:

The value obtained from the index can vary depending on different characteristics of the water. This is helpful in detecting changes in water clarity, colours, and outlines of bodies of water. NDWI was previously used interchangeably with NDMI, however in recent years they have been treated as separate with NDWI used to determine land-water boundaries and NDMI as the primary index of leaf moisture content.
Normalised Difference Moisture Index (NDMI)
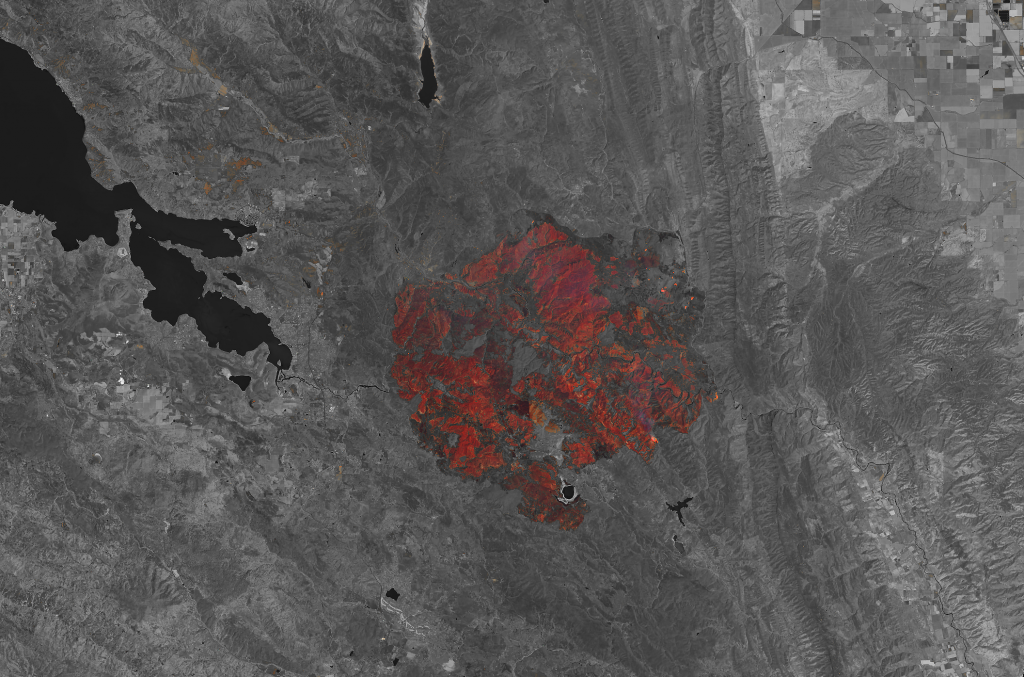
Captured by Landsat- 8 OLI on 3 August, 2015.
NDMI is used to measure the moisture content of vegetation using NIR and SWIR bands. The following equation is used to calculate the value:

The resulting value ranges from -1 to +1, with the following indications:

The resulting NDMI values are useful in mapping for many different industries. When it comes to ecosystem management, the value is a good indicator of ecosystem health and stress by providing data on canopy moisture. As moisture levels change, the data gathered from NDMI can help determine fire prone areas. It is also an effective indicator of deforestation. In agriculture, the values are helpful in monitoring irrigation of crops, to effectively manage water use and maintain fields.
Seeking to better manage NDVI, NDWI, and NDMI data?
With valuable EO data in reach, the establishment of an efficient and effective data management and procurement system is essential. Arlula’s Geostack Enterprise offers EO data consumers the capability to tailor their data requirements through customisable data processing functionalities, thereby enhancing situational awareness and improving decision-making processes.
Conclusion
The capability of satellites to capture a wide array of high-quality satellite imagery through their diverse sensors has proven to be an invaluable asset for understanding and monitoring earth’s surface. Water bodies and vegetation, crucial components of Earth’s ecosystems, can be effectively monitored using the information gathered from these sensors. This information provides data used to calculate the derived bands NDVI, NDWI, and NDMI. Fields such as agriculture, ecology, and conservation use these indices as well as a data management platform such as Geostack Terra to address complex challenges and enhance our ability to make decisions for a sustainable future.
What is the difference between NDWI and NDMI?
While they are similar and have been used interchangeably, there is a slight distinction between the two. NDWI uses NIR and visible Green Light to assess water content and features. The index is beneficial to identify water bodies and assess water quality and availability.
NDMI uses NIR and SWIR to assess moisture content of vegetation. The index is beneficial to monitor plant water stress, drought conditions, and fire risk.
Both are useful indices for monitoring vegetation health. Explore providers with these bands in Arlula’s Geostack.
How do derived bands work?
Sensors on satellites are designed to acquire data within different ranges of frequencies along the EM spectrum. Derived bands are calculated by comparing the amount of absorbed and reflected light of these bands. The wavelength of light used will depend on the index you are calculating. To see which operator offers your required bands, browse through our data sources or explore Geostack
How to visualise derived bands?
Maps and graphs are a beneficial way to visualise the data retrieved from derived bands. Imagery and data can be applied to desired programs to meet program needs. Looking to easily and efficiently manage your data? Learn more about Arlula’s data management platform Geostack Enterprise.
More news

.png)

Let’s talk about how you run EO today
Most conversations start with understanding your current systems, workflows and constraints to see how Arlula can empower your team.