How to Get the Most Out of Your Satellite Data
This guide covers important considerations when purchasing satellite data to ensure you get the best imagery for your needs.

So, you are ready to purchase satellite data, but how do you make sure you get the most out of it?
Satellite imagery has emerged as a useful tool in many industries due to its large coverage area, consistency and regularity of data capture, and accessibility. As satellite data has become more easily available through platforms such as Geostack, businesses and industries need to know how to unlock the information opportunity from satellite imagery. Depending on the industry and project type, there are specific ways that the imagery is selected and used to maximise its value. In this guide, we will go through important things to consider before and after purchasing to ensure you get the best imagery for your unique needs.
Understanding Resolution
As satellite imagery has developed over the last 50+ years, resolution has improved drastically. Essentially, this means that the level of detail in an image is much greater.
Spatial resolution is the most commonly used measurement in optical satellite imagery, and refers to the size of the smallest object that can be seen as separate from its surroundings. Often, spatial resolution is reported as ground sampling distance (GSD), or how big each pixel is on the ground. For example, in an image with a resolution of 10 metres, each pixel would represent an area of 10m X 10m.
Images are categorised into high-, medium- and low- resolution. The lower the GSD, the finer the detail and therefore, higher the resolution.

Wouldn’t everyone want the highest resolution? The resolution you choose would depend on the purpose of the imagery, the features or processes, and available budget and resources. For example, low resolution imagery is useful in detecting abnormalities. It is a low cost tool that can lead to a more robust response. Similarly, if the value of the data lies in the type of information, such as from multiple spectral bands, rather than the overall detail of the image, low-resolution may be a better fit. On the contrary, if you need a high level of detail to identify features, for example pathogens on crops within a field, high resolution resolution may be more effective. If you are not sure what best meets your requirements, the Arlula team is glad to help.
Types of Sensors
Satellites are equipped with sensors that capture specific energy wavelengths along the Electromagnetic spectrum (EM) that are reflected off of the earth’s surface. These capabilities are defined as spectral bands. The data that is captured by the sensor is then processed into an image.
Satellites and operators use different sensors. These sensors can provide valuable insight of different characteristics and features in the areas captured. The type of sensor you use will be dependent on the information desired and budget. Search platforms, such as Geostack, allow users to customise their search by operators to simplify this process.
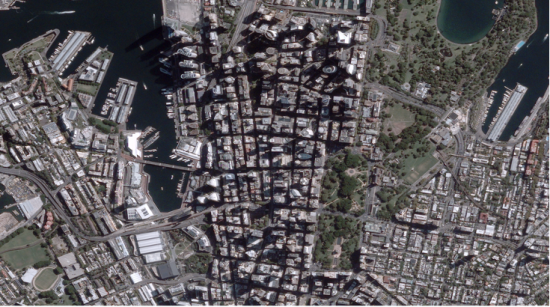
Sydney, Australia. Captured by Blacksky, 2023.
RGB and Multispectral
RGB and multispectral imagery are a type of optical satellite imagery which uses a passive sensor, meaning it captures naturally available wavelengths such as visible light, near-infrared and short-wave infrared. These sensors can be used to produce true-colour images, measure temperature, and visualise features invisible to the naked eye. Overall, multispectral imagery is a versatile tool to empower critical decisions.
Pros:
- Multispectral satellites require less energy, which makes them a more cost-effective option
- Extensive archive collections
- Wide range of resolutions, to meet individual requirements
Cons:
- Multispectral Satellites depend on the light from the sun, therefore are limited by the day/night cycle.
- AOI visibility affected by cloud cover
Panchromatic
Panchromatic imagery, similar to above, uses the red, green, and blue bands. However, instead of individual bands, Panchromatic combines the bands into one, single band. The resulting image is delivered in greyscale, with the data value in the brightness. Combining a panchromatic band with a multispectral image can improve the spatial resolution of the multispectral image. This process is called pan-sharpening.
Pros:
- Beneficial for detecting brightness differences
- Higher spatial resolution
- More-affordable
Cons:
- Does not display true colours
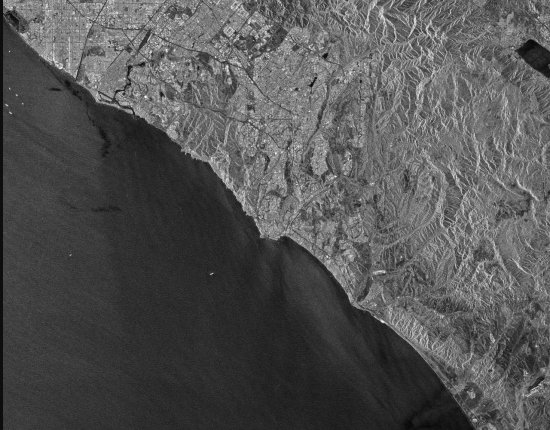
SAR image of possible oil slick off the coast of California, USA. Captured by Sentinel-1B 3 Oct. 2021.
SAR
Synthetic aperture radar, also known as SAR, is an active sensor. This means that it produces its own energy. The sensor then measures how that energy is scattered and reflected off the earth’s surface. SAR images are delivered in greyscale, with lighter areas indicating more reflectance, and darker areas indicating low reflectance. SAR is useful to measure topography, mapping sea states and ice hazards, monitor wildfires or floods and tracking deforestation.
Pros:
- SAR can penetrate clouds, smoke and dust.
- Does not depend on visible light, so can capture images at night
Cons:
- More expensive
- Lower resolution, can be noisy
- Requires processing before use
Hyperspectral
Where optical imaging uses 3-4 bands, hyperspectral is capable of passively capturing 37+ individual bands along the EM spectrum. This results in an image with a higher spectral resolution, with each pixel assigned an entire spectrum. Because of its high spectral resolution, it is extremely useful in identifying surface minerals, mapping vegetation species and evaluating shallow coastal habitats.
Pros:
- Higher spectral resolution, for more elaborate spectral analysis
- Can detect more features than multispectral imagery
Cons:
- Large data size
- Lower spatial resolution
- More expensive

Hyperspectral image of Mt Fuji, Japan. Captured by EO-1 Hyperion.
LiDAR
LiDAR, is another active sensor that uses pulses of light to measure elevation and shapes. Because light travels at a constant known speed, LiDAR systems can accurately calculate the distance between the on-board light source and the collision point on the earth’s surface. As the satellite orbits, the series of light pulses and detected collisions can build a precise 3-dimensional map of elevation and topography. LiDAR is useful for environmental assessments, infrastructure mapping, and precision agriculture.
Pros:
- With its own light source, LiDAR is able to capture imagery during the day or night
- Accurate and consistent data, beneficial for creating 3D models
- Effective even in areas with dense vegetation
Cons:
- More expensive
- Irregularly spaced
- Limited spectral information

LiDAR data of natural land depressions scattered throughout the Atlantic coastal plain of the United States. These are the Carolina Bays in North Carolina, USA. Captured by aerial lidar in December 2000.
Manage Your Data
You have decided on the types of imagery you would like to use. The next thing to consider is how you will store and manage your satellite data. Purchasing a few one-off images, while large files, may not make a huge dent in your data storage. However, frequent or repeated captures will start to rack up space. Thankfully, there are solutions to help you best store, manage, and access your satellite imagery data. For example, with Arlula’s platform once imagery is acquired, it is securely stored within Arlula’s cloud-based storage infrastructure, facilitating further analysis and streamlined sharing. Ready to scale-up your satellite imagery procurement and management? With Arlula’s Geostack Enterprise, EO data users can easily access imagery from multiple vendors, effortlessly customise and manage operational controls, and maximise data-driven insights through advanced visualisation tools all within one consolidated platform. Additionally, enhance organisation and sharing of large data sets with the collections feature.
Alternative Band Orders and Derived Bands
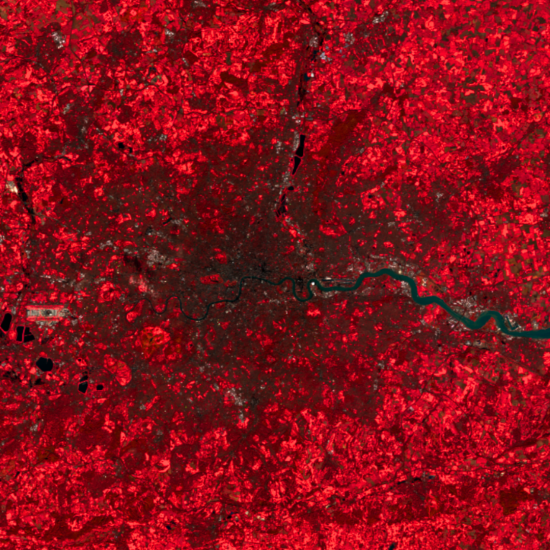
Once your imagery is delivered, you can customise how you view the spectral bands. Changing the type and order of the spectral bands, will provide insight into different features and characteristics. True colour or natural images use the red, green, and blue bands, in that respective order. With a true colour image, you can see different surface types (vegetation vs. sand vs. water), atmospheric features such as clouds and other characteristics such as smoke or haze. This band combination is especially useful in identifying sedimentation in water and for observing man-made objects and infrastructure.
Unfortunately, natural colour images can be low in contrast. Changing the order of bands or substituting any of the above with additional spectral bands produces a false colour image. False colour images visualise wavelengths that are invisible to the human eye and emphasise properties that are difficult to distinguish. Using different combinations of red, green, blue, near-infrared and short-wave infrared bands, leverages the natural reflectance of vegetation, water, soil and fire, to make the features brighter and more distinct from their surroundings. Additionally, calculating derived bands provides valuable insight into characteristics of the land such as vegetation health or density and soil moisture levels.
False colour image of agriculture fields in the Toowoomba Region of Queensland. Captured by Sentinel-2 L2A on 3 April 2024.
Integrate
Already have existing data systems? Satellite imagery data can be easily integrated to complement existing processes. For example, integrating satellite data with GIS workflows, can help to update maps and detect changes in survey areas. Together, multilayered data-rich maps can be created to aid in the visualisation and analysis of data.
Touch Up The Image
Finally, give your satellite image a little touch up. In a photo editing platform or free satellite imagery viewer such as QGIS. Make light adjustments to the contrast, saturation and sharpness of the image to better distinguish and identify the features within the image. Be careful not to over edit the image so that false information is interpreted.
Now That You Know How To Maximise Your Satellite Data…
There you have it! We hope that these tips help you to get the most out of your satellite data. Satellite imagery provides numerous insights to many different industries, and the value can be maximised when the data is leveraged correctly. The next step is to start searching for imagery! Arlula’s Geostack lets you effortlessly navigate and conduct more refined searches for relevant data at speed and scale to help power your critical decisions and get the most out of satellite data.
What is the difference between satellite imagery and Google Earth images?
Google earth is great if you are looking for simply a geobrowser. However, if you would like to have the most accurate and customisable data, satellite imagery is the best choice! With different sensors, resolutions and data types, satellite imagery provides much more accurate and comprehensive data for individual needs. To see the difference, explore available imagery on Geostack!
How do I get real-time satellite data?
Due to capture, processing, and delivery capabilities “real-time satellite data” is not quite achievable. However, there are many options that can schedule new satellite imagery with tasking and deliver near-real time satellite data within just a few hours. To explore these options, check out the Tasking providers on Geostack.
How far back does satellite imagery go?
Commercially available satellite imagery can date back to 40+ years ago. To browse archive imagery, check out the archive search on Geostack.
More news

.png)

Let’s talk about how you run EO today
Most conversations start with understanding your current systems, workflows and constraints to see how Arlula can empower your team.