Tackling the Urban Heat Island Effect with Satellite Imagery
Discover how satellite imagery can help to address the urban heat island effect by observing how three distinct regions- Western Sydney, Minnesota, and London- are impacted.
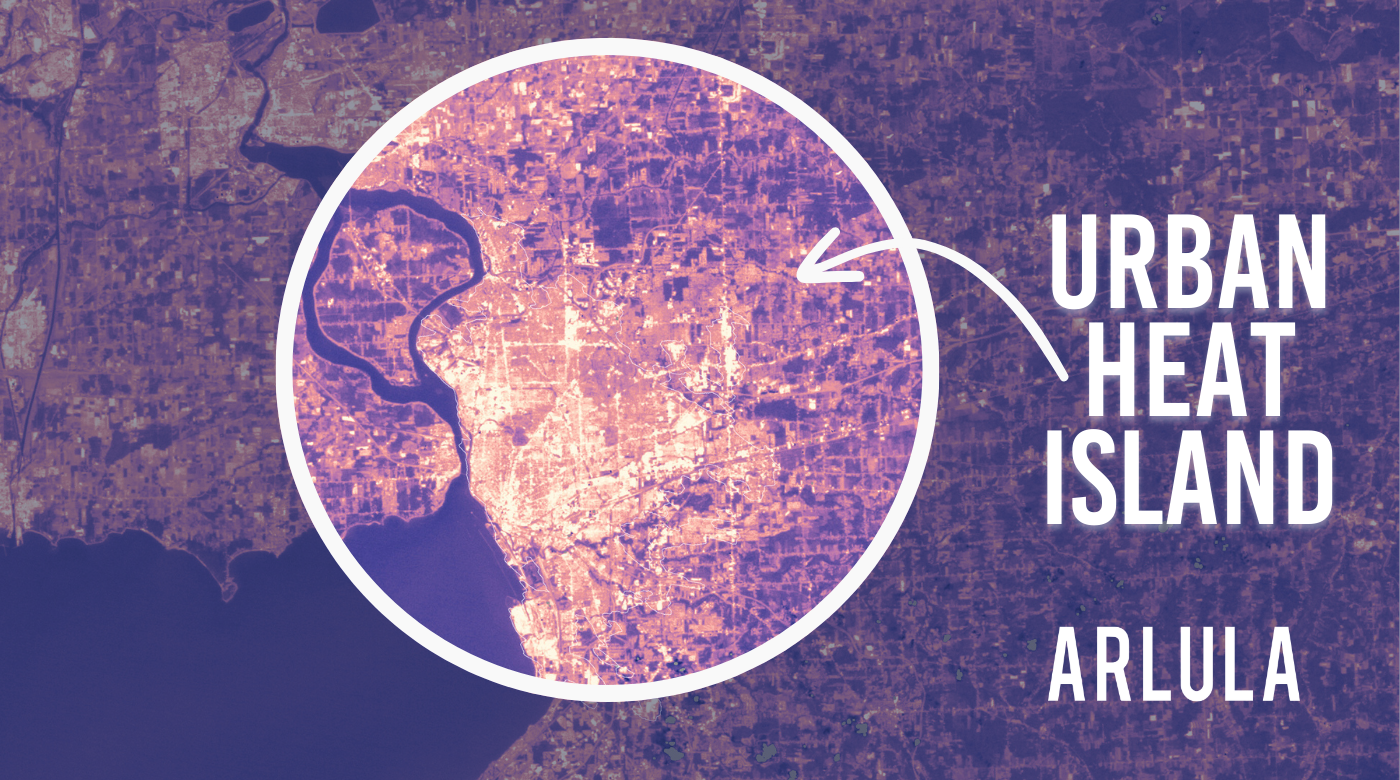
Have you ever heard the saying “it’s so hot you could fry an egg on the sidewalk”? While that may not be quite possible, there is a reason it is said about sidewalks and not lawns. On average, cities experience temperatures 1℃ to 3℃ higher than their rural counterparts. In some areas, this temperature difference can be even more pronounced. With gradually increasing temperatures year round, urban areas are particularly susceptible to these shifts. This is a concept known as the Urban Heat Island Effect.
With the expansion of urban areas, driven by growing populations, there has been a need to connect communities via roads and other paved infrastructure. This urban expansion often involves the clearance of natural areas to make space for new buildings, housing developments, car parks, and streets. These man-made surfaces absorb heat during the day and gradually release it throughout the night. Additionally, the condensed city design and taller buildings in urban areas obstructs natural airflow and traps heat within urban centres. Together, these characteristics raise the average temperature, creating localised hot spots over urban areas.
In contrast, rural areas tend to maintain cooler temperatures. Less urban development preserves a higher percentage of vegetation cover. Plants play a crucial role in reflecting heat and providing shade. In addition, proximity of rural areas to waterways, such as lakes and rivers, acts as a buffer, further cooling the air and surfaces as it evaporates.
As urbanisation continues, the urban heat islands that are created, further impact climate change. Without natural land and vegetation to help regulate temperatures, the average temperatures around cities are rising and do not fluctuate as they naturally would. This increased heat ultimately impacts the health and wellbeing of the people living in urban areas. To improve quality of life and mitigate the effect of urban heat islands, careful city planning is essential.
Satellite Imagery is a useful tool for addressing these challenges and supporting urban planning efforts. Thermal maps derived from satellite data can be used to continuously monitor surface temperatures, and optical imagery can provide visual data on how surfaces and land use has changed over time. High-quality satellite imagery plays a pivotal role in identifying areas of most concern and aiding in the design and implementation of greening projects. Once completed, recurring image capture allows for careful monitoring to observe changes and assess effectiveness of the measures in place.
Here we will observe how three distinct regions – Western Sydney, Minnesota, and London – are impacted by the Urban Heat Island Effect.
1. Western Sydney, Australia
It is often the communities that lie further inland, as opposed to their coastal neighbours, that bear the brunt of the Urban Heat Island Effect. Western Sydney is no exception to this. The region can experience temperatures that are 10℃ hotter than temperatures in the Eastern Suburbs. Why might this be? Compared to its coastal neighbours, Western Sydney is undergoing rapid expansion in terms of population and economic development. It is projected that by 2036, nearly half of Sydney’s population will live in Western Sydney. In an effort to keep economic development up with the growing population, several development projects are underway, including the new Western Sydney Airport and upgrading roads to 4+ lanes, in the effort to provide more employment opportunities to the region. These projects as well as growing residential areas, have contributed to a greater surface area of materials that absorb and retain heat. Marsden Park is a new community in Sydney’s northwest. The development includes up to 10,300 new homes, upgraded raids, new schools, and a new town centre.
Development in Marsden Park, NSW from September 2017 (left) to December 2023 (right). Captured by Sentinel-2 l2A.
One particular concern with the increasing temperatures, is the consumption of energy in this particular region of Australia. As more people and businesses require power to stay cool, there is a heightened demand for electricity, especially during heat waves. Additionally, there are concerns as to how social and mental health are affected by the Urban Heat Island Effect. As community members are less inclined to recreate in parks and participate in social sports outdoors due to extreme temperatures, preserving community well-being has been a point of discussion.
2. Minnesota, USA
Another concern with Urban Heat Islands is the disproportionate effects they have on communities. Wealthier areas with resources for landscaping, public park maintenance, and amenities such as air conditioning, tend to run cooler than low income areas. As temperatures rise, so does demand for cooling methods. The increased use of utilities, particularly air conditioning, puts stress on the electrical grid. Areas that have less advanced electrical grid systems and limited resources are vulnerable to overload during heat waves and peak times, as has been evident in various neighbourhoods throughout New York City.
In the United States, the Minnesota State Government has recognized this impact and has proposed several policies aimed at addressing climate change and resilience in regards to development. One such policy is the Minnesota Land Planning Act. With 50% of the city’s land area consisting of impervious surfaces, these policies are addressing the needs of local governments to achieve climate resilience in both existing and new developments. This includes establishing cooling centres for those without access to air conditioning, providing fresh water stations, ensuring a strong power grid, and increasing vegetation coverage. Collectively, these features contribute to a more equitable, sustainable, and climate resilient urban community.

SAR imagery of Minneapolis, Minnesota. The brighter areas are areas with more urbanisation. Captured by Sentinel-1 on 6 Oct. 2023.
3. London, England
While many believe England to be a cloudy and rainy country, London hosts one of the most extreme urban heat islands. A 2023 report utilising AI and satellite imagery, found that London has one of the most extreme urban heat islands, especially during the evening and night, when compared to other major cities around the world. During the daytime, the materials that make up streets and buildings absorb and store heat. Once the sun sets, that heat is slowly released, continuing to warm the air long after the sun has gone down. In addition, the study compares the temperature of different regions within these cities in contrast to vegetation cover. The study found that in most cities examined, the most extreme heat was observed in areas with less than 6% vegetation cover, while the coolest areas had a vegetation cover of over 70%. Within the cities surveyed, many of the coolest areas were found in parks and greenspaces, emphasising the critical role vegetation holds in mitigating urban heat.
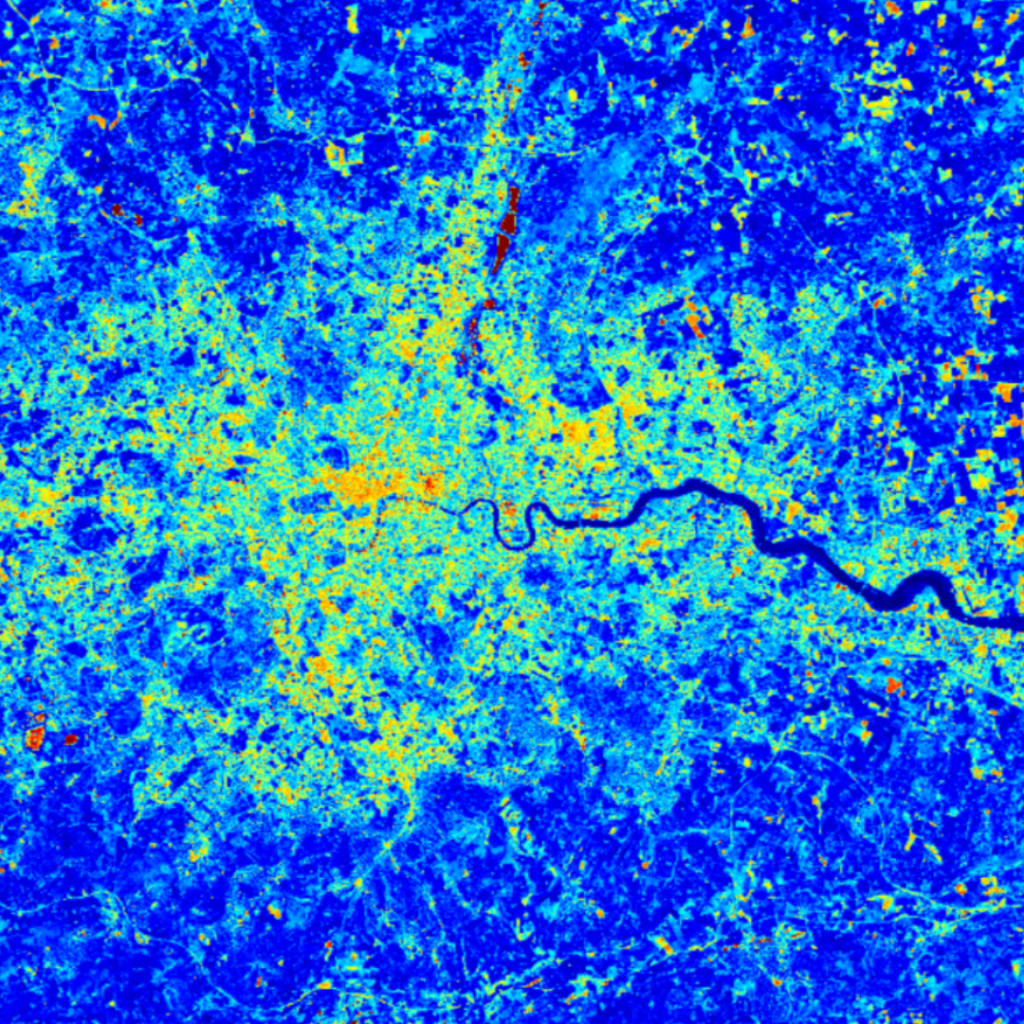
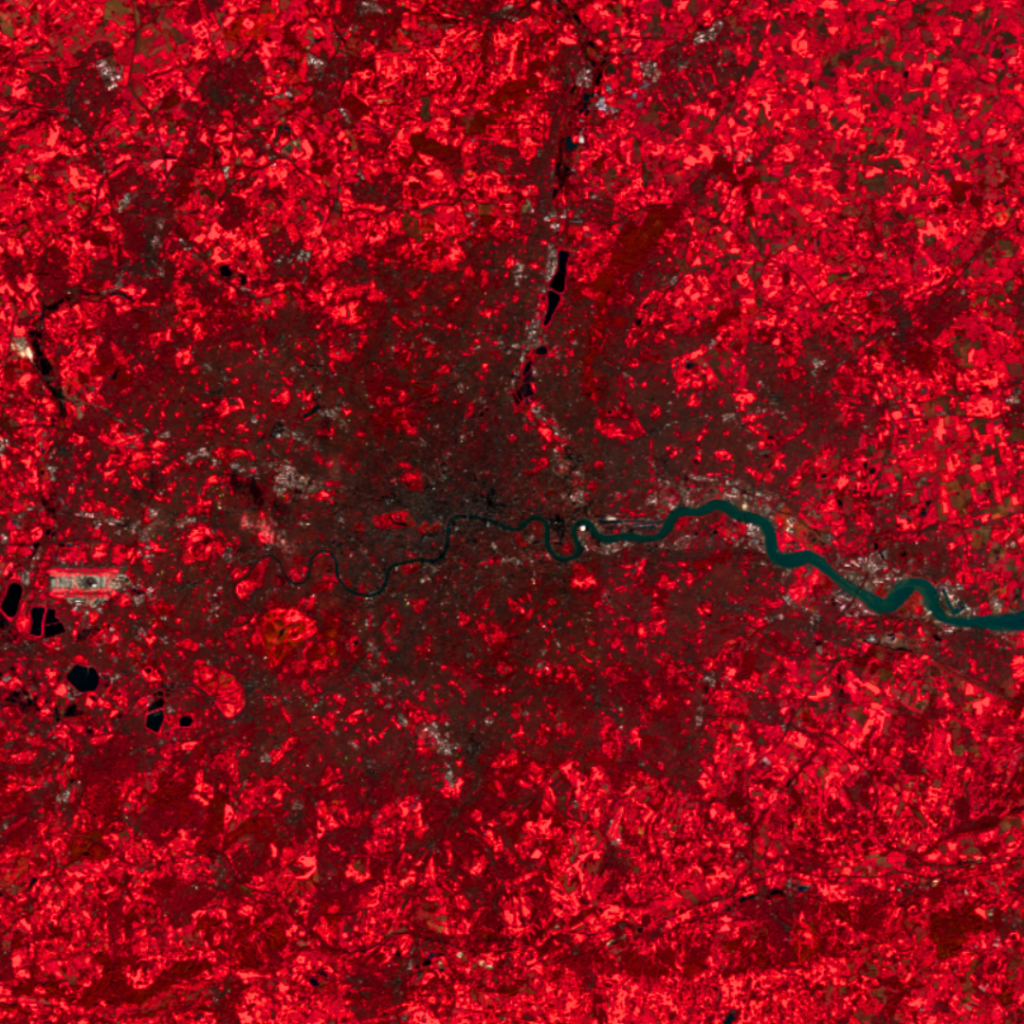
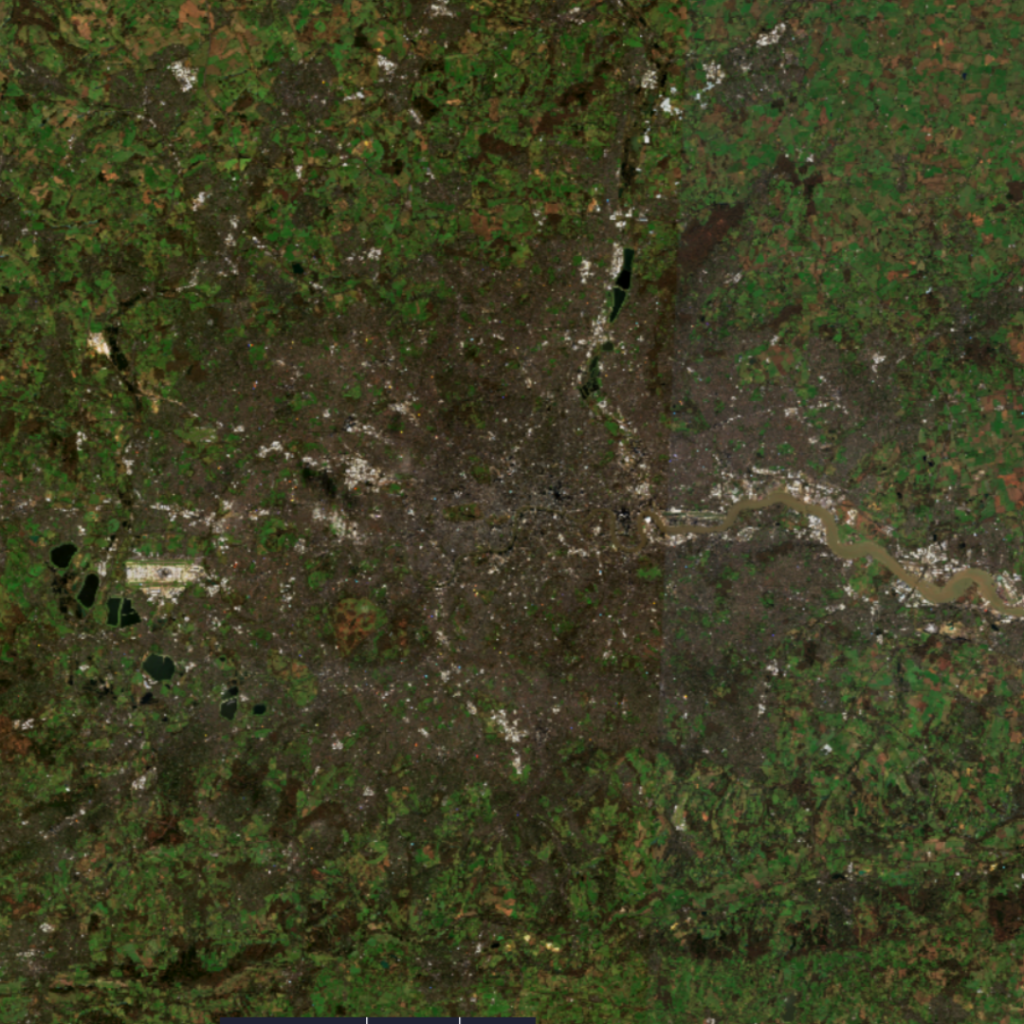
London as seen through different bandwidths: Moisture levels (left), false colour (middle) and true colour (right). Captured by Sentinel-2 L2A on 21 January 2023.
Concerns and Negative Effects
The Urban Heat Island Effect most obviously manifests in consistently higher daytime temperatures. The extreme heat contributes to heat-related illnesses such as heat exhaustion, respiratory difficulties, general discomfort, and in severe cases, death. In a recent study completed in Europe, over 4% of deaths were attributed to urban heat islands. There is increased concern when it comes to vulnerable populations such as elderly, young children, and low-income communities.

When temperatures rise, the demand for cooling methods increases as well. Increased use of utilities such as air conditioning puts significant stress on the electrical grid. Despite the heightened expenses for energy during peak times, this demand can overload electrical systems. Cities with less advanced electrical grid systems and limited resources are especially vulnerable during these times.
Beyond the physical implications, there are also social factors affected by the Urban Heat Island Effect. Extreme heat deters community members from leaving the comfort of their home or gathering outside in areas such as parks and playgrounds. This ultimately impacts the social and mental health of individuals residing in areas affected by urban heat islands, contributing to a decline in quality of life and community well-being.
What You Can Do to Prepare
While many are affected by the Urban Heat Island Effect, there are several ways to prepare and mitigate the effects in order to ensure areas are more resilient to heat waves and other extreme weather events. As temperatures in Singapore reached record highs this past summer, the government launched a heat stress management program. The program identifies different levels of heat stress based on temperature and provides recommendations for types of activity, attire, and actions to best manage heat stress in those conditions. These tips and precautions serve as a temporary measure to cope with the effects of urban heat, and can be a model to other countries as they brace for extreme temperatures. Other methods to reduce heat are using light coloured or reflective building materials, increasing vegetation cover through projects such as green roofs and tree plantings, and incorporating green infrastructure.

Heat Stress Advisory (Meteorological Survey Singapore 2023)
Whilst these methods help assist in decreasing the heat within these areas, these measures are more of a short-term solution. In these instances, recurring satellite imagery can help map and monitor entire cities, to see which areas experience the highest levels of heat stress and how they change over the course of a day or season. Additionally, satellite imagery enables efficient planning and monitoring of infrastructure improvement and greening projects. Frequent and up to date information is essential in these scenarios. By applying this data-driven approach, cities worldwide can make informed decisions and respond proactively to safeguard the well-being of their communities during extreme temperature events.
Take Action Today
The Urban Heat Island effect is a global issue that continues to evolve. Take action with Arlula and power the critical decisions surrounding the Urban Heat Island Effect. Whether you need to task imagery to rapidly monitor temperature changes or utilise EO data management tools to pinpoint areas of greatest concern, satellite imagery is invaluable to develop actionable change. Learn more about Arlula’s satellite imagery and EO data solutions today.
More news

.png)

Let’s talk about how you run EO today
Most conversations start with understanding your current systems, workflows and constraints to see how Arlula can empower your team.